1. Load Sentinel-1 GRD
The Sentinel-1 mission provides data from a dual-polarization C-band Synthetic Aperture Radar (SAR) instrument at 5.405GHz (C band). This collection includes the S1 Ground Range Detected (GRD) scenes, processed using the Sentinel-1 Toolbox to generate a calibrated, ortho-corrected product. The collection is updated daily. New assets are ingested within two days after they become available.
// Load Sentinel-1 GRD

var sentinel_1 = ee.ImageCollection("COPERNICUS/S1_GRD")
Earth Engine uses the following preprocessing steps (as implemented by the Sentinel-1 Toolbox) to derive the backscatter coefficient in each pixel (source) :
- Apply orbit file
- Updates orbit metadata with a restituted orbit file (or a precise orbit file if the restituted one is not available).
- GRD border noise removal
- Removes low intensity noise and invalid data on scene edges.
- Thermal noise removal
- Removes additive noise in sub-swaths to help reduce discontinuities between sub-swaths for scenes in multi-swath acquisition modes.
- Radiometric calibration
- Computes backscatter intensity using sensor calibration parameters in the GRD metadata.
- Terrain correction (orthorectification)
- Converts data from ground range geometry, which does not take terrain into account, to σ° using the SRTM 30 meter DEM or the ASTER DEM for high latitudes (greater than 60° or less than -60°).
- Converstion to dB
- The final terrain-corrected values are converted to decibels via log scaling (10*log10(x)) because it can vary by several orders of magnitude?
Note
- Radiometric Terrain Flattening is not being applied due to artifacts on mountain slopes.
- Sentinel-1 SLC data cannot currently be ingested, as Earth Engine does not support images with complex values due to inability to average them during pyramiding without losing phase information.
For more information about these pre-processing steps, please refer to the Sentinel-1 Pre-processing article. For further advice on working with Sentinel-1 imagery, see Guido Lemoine’s tutorial on SAR basics and Mort Canty’s tutorial on SAR change detection.
1.1 Filter Sentinel-1 data
// Define time period, polarisation and orbit direction
var startDate = '2019-01-01'
var endDate   = '2019-12-31'

var polarisation   = 'VV'
var orbitDirection = 'DESCENDING'
var instrument     = 'IW'
// Select S1 IW images in area of interest and time period
var s1_filter = sentinel_1
                .filter(ee.Filter.eq('instrumentMode', instrument))
                .filter(ee.Filter.listContains('transmitterReceiverPolarisation', polarisation))
                .select(polarisation)
                .filter(ee.Filter.eq('orbitProperties_pass', orbitDirection))
                .filterDate(startDate, endDate)
                .filterBounds(roi)
2. Composite
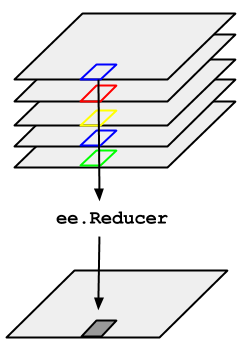
Reducers are the way to aggregate data over time, space, bands, arrays and other data structures in Earth Engine. The ee.Reducer class specifies how data is aggregated. The reducers in this class can specify a simple statistic to use for the aggregation (e.g. minimum, maximum, mean, median, standard deviation, etc.), or a more complex summary of the input data (e.g. histogram, linear regression, list).
Reductions may occur over :
- time (
imageCollection.reduce()), - space (
image.reduceRegion(),image.reduceNeighborhood()), - bands (
image.reduce()), - attribute space of a
FeatureCollection** (featureCollection.reduceColumns()orFeatureCollectionmethods that start withaggregate_).
Consider the example of needing to take the median over a time series of images represented by an ImageCollection. To reduce an ImageCollection, use imageCollection.reduce(). This reduces the collection of images to an individual image. Specifically, the output is computed pixel-wise, such that each pixel in the output is composed of the median value of all the images in the collection at that location. To get other statistics, such as mean, sum, variance, an arbitrary percentile, etc., the appropriate reducer should be selected and applied.
For basic statistics like min, max, mean, etc.,
ImageCollectionhas shortcut methods likemin(),max(),mean(), etc. They function in exactly the same way as callingreduce(), except the resultant band names will not have the name of the reducer appended.
To composite images in an ImageCollection, use imageCollection.reduce(). This will composite all the images in the collection to a single image representing, for example, the min, max, mean or standard deviation of the images.

2.1 Composite over a single time period
var startPeriod = '2019-01-01'
var endPeriod   = '2019-03-31'
// Compute mean over a period and clip to the ROI extent

var s1_mean = s1_filter
                    .filterDate(startPeriod, endPeriod)
                    .reduce(ee.Reducer.mean())
                    .clip(roi)
// Compute standard deviation over a period and clip to the ROI extent

var s1_std  = s1_filter
                    .filterDate(startPeriod, endPeriod)
                    .reduce(ee.Reducer.stdDev())
                    .clip(roi)
2.2 Composite over mulitple time periods
// List of months
var months = ee.List.sequence(1, 12)
print("Months : ",months)

// List of years
var years = ee.List.sequence(2019, 2019)
print("Years : ",years)

// Use .map() to compute monthly composite and clip them to the ROI
var monthly_mean = ee.ImageCollection.fromImages(
  years.map(function (y) {
        return months.map(function (m) {
                return s1_filter
                        .filter(ee.Filter.calendarRange(y, y, 'year'))
                        .filter(ee.Filter.calendarRange(m, m, 'month'))
                        .reduce(ee.Reducer.mean())
                        .set('year',y)
                        .set('month',m);
            });
  })
  .flatten())
  .map(function(image){return image.clip(roi)})
3. Visualization
3.1 Visualize single image
Map.centerObject(roi, 12)
Map.addLayer(s1_mean, {min: -25, max: 5}, 'yearly mean', true)
Map.addLayer(s1_std, {min: 0, max: 4}, 'yearly std', true)
3.2 Visualize imageCollection
3.2.1 Map layers
var listOfImages = monthly_mean.toList(monthly_mean.size())
print('List:',listOfImages)

// Get the size of the image list
var len = listOfImages.size()

len.evaluate(function(l) {
  for (var i=0; i < l; i++) {
    var img = ee.Image(listOfImages.get(i));
    var month = img.get('month').getInfo();
    var year  = img.get('year').getInfo();
    Map.addLayer(img, {min: -25, max:5}, month.toString() + '/' + year.toString());
  }
})
3.2.2 GIF
// Define arguments for animation function parameters.
var videoArgs = {
  dimensions: 800,
  region: roi.geometry(),
  framesPerSecond: 1,
  crs: 'EPSG:3857',
  min: -25.0,
  max: 5.0
};

print(ui.Thumbnail(monthly_mean, videoArgs))
print(monthly_mean.getVideoThumbURL(videoArgs))